The Year Ahead In Macro - A Delphi Summary
Jam packed with incredible macro insight, this needs a substack of its own
Delphis’ 2023 Macro Newsletter is one I thoroughly enjoyed and really felt that I had to break down because it’s just packed full of insight. At 80 pages, it’s a behemoth to go through - but don’t worry, I’m here to help.
Two Halves - 2021 as the Year of Massive Stimulation, 2022 as the Year of Great Resets - sizable corrections are healthy for long-term uptrends
Overall, crypto is macro now.
State Of The Crypto Market - Technical Insights
BTC is now trading in the range of its previous 2017 peak and summer 2019 retest - an incredibly vulnerable area
BTC is down ~76% from its prior ATH, and historically, the price of BTC fell ~85% from peak-to-trough in past bear markets
Similarly, ETH is down ~76% off its prior ATH, and historically the price of ETH fell 93% from peak-to-trough in the 2017-2018 cycle
If the market were to mimic the same peak-to-trough drawdown of last cycle’s
(-~93%), the total market cap for the broader crypto market would have to fall ~60%Correlations between crypto and traditional asset classes have been tight over the last 12 months
BTC is now trading 2 standard deviations below its long-term trend
Prior bottoms were marked by a sell-off to push BTC into oversold on it’s
14-Month RSI and test of its 200-Week MA, which has historically acted as strong support. BTC has been rangebound since entering this area.Overall, if one were to take past performance as a historical indicator, we would expect to. see markets consolidate into Q1 2023 before forming a clear bottoming pattern. But more importantly, this is dependent on a reversal in key macro headwinds.
This brings us to the macro insights that I absolutely love in this article:
Liquidity Rules Everything Around Me
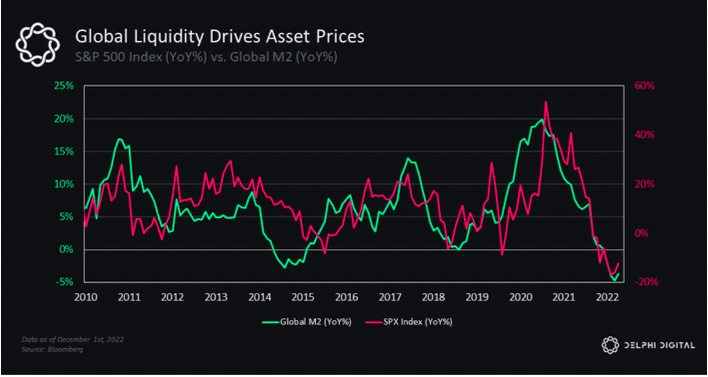
Global liquidity cycles have a strong correlation with the business cycle, and the business cycle drives changes in asset prices. Therefore, global liquidity drives macro, and fluctuations in global equity markets.
The charts pit Global M2 against SPX and BTC - showing clear signs of correlations. Nuff said.
But while M2 is not an omniscient measurement of global liquidity, it serves as a good proxy. It tracks trends in major central bank balance sheets, which have shown strong correlation with asset prices as well.
Global liquidity was what drove growth in 2020 - hence, a reversal in global liquidity might be one of the most important catalysts for a renewed bull market.
Analyzing The Global Liquidity Cycle
There are signs that a reversal in liquidity is coming. “The cycle moves in 5-6 year waves and is currently just starting to turn higher from its mid-2022 lows. Global liquidity leads financial markets by some 6-12 months and economies by around 12-18 months...it shows that we are at ‘maximum tightness” - CrossBorder Capital
The two biggest contributors to global liquidity are US and China, so it’s important to focus on them. Households in US and China make up nearly half of the world’s personal wealth.
For China, here are the relevant data points:
China’s Credit Impulse has seen a positive net uptick, which tends to lead to reversals in global M2 growth
The same uptick has shown (in recent years) to lead to DXY’s reversal
And global liquidity cycles have an inverse relationship with the dollar, meaning a strong dollar would lead to less liquidity, and vice versa
For the US, here are the relevant data points:
Tighter US financial conditions have shown to be restrictive towards markets
The US has yet to show signs of a liquidity reversal, unlike China. The problem is that the Fed doesn’t want loose financial conditions because they want to first crush inflation.
Hence, the reversal isn’t here - yet. But we have to keep our eyes on changes in liquidity - a more expansionary liquidity environment will give stronger conviction that a bottom is in the rearview.
Analyzing the US Dollar
Aggressive monetary tightening, demand for dollars and US safe-havens, and the contraction in global liquidity helped propel the dollar to 20-year highs.
A stronger greenback implies tighter monetary conditions, which don’t favour assets like BTC that tend to move inversely with USD.
The fight against inflation has prompted a synchronized tightening of rates globally, and the strong dollar has rallied in that regard
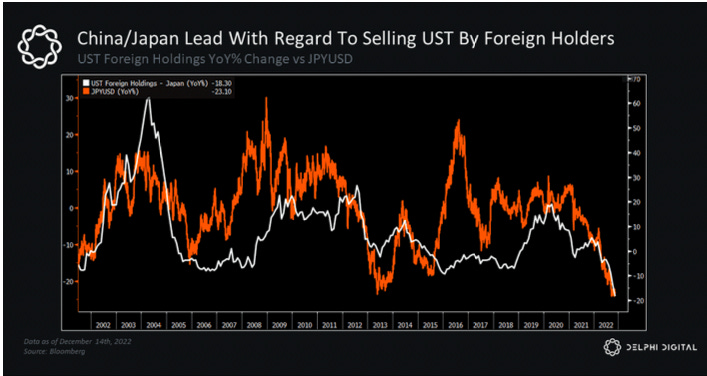
However, October marked the turning point, and other countries have started selling dollar reserves to defend their own currencies
Long dollar is also one of the most overcrowded trades
Global liquidity cycles have an inverse relationship with the dollar, and so, if we expect the liquidity cycle to turn, we have to see a reversal in the USD
We’re not out of danger yet - another wave of dollar strength is still a key risk as we move into 2023, as the dollar is the “cleanest shirt in the laundry”. Capital could flow back into the dollar, and in such a case it will tighten financial conditions even further, as dollar-denominated debt outside the US will cause massive stress on financial systems.
The Last Narrative: Inflation Risk → Recession Risk
While the Fed remains focused on crushing inflation, the tool in its kit to do that is to engineer a period of below-trend growth
Believe that Fed will aim to keep financial conditions tight for a prolonged period to avoid the mistakes of the 1970s. As such, there may be a risk of a recession
Typically, we see the unemployment rate start to tick up and cross over its 12- month moving average heading into recessions. The current 12-month moving average is right in line with the latest unemployment rate print, but the Fed’s latest forecast shows unemployment rising to 4.6% next year, which would put us on a similar track to prior recession examples.
That’s all folks, I hope you enjoyed this summary piece!


